| Chapter 3: Conformations of Alkanes and Cycloalkanes |
| Chapter 3: Conformations of Alkanes and Cycloalkanes |
Drawing and Understanding Diagrams
The ability to draw and interpret the different diagrams that are used to represent the different conformations is a very important skill to acquire. It will likely require that you maximise your artistic skills! The only person that will be decieved by your poor diagrams is you! Your instructor(s) will be able to tell instantly that you are struggling, don't know or are trying to hide that you don't really know.
We need these diagrams because molecules typically have 3D shapes associated with them and we need to be able to accurately depict those 3D shapes on a 2D page (paper or screen). In many ways this is similar to the way we look at the plans for a house or a Lego kit where we use those plans to create that object exactly as intended. The different types of diagrams each have a specific feature that defines the way they need to be drawn and interpretted. This then allows for the unambiguous interpretation of those diagrams. It is these features that are important to know and understand.
Lewis diagrams or structures are used to show the connectivity (bonding) between the atoms within a molecule complete with lone pairs (non-bonding electrons). Each atom in the molecule is shown as its chemical symbol in its position in the molecule. Bonds are represented by lines and lone pairs as pairs of dots on the corresponding atom. In a complete Lewis structure, the covalent bonds are also represented as a pair of electrons rather than a line. Intuitively, a double bond is represented as a pair of lines and a triple bond as 3 lines ( = and ≡respectively).
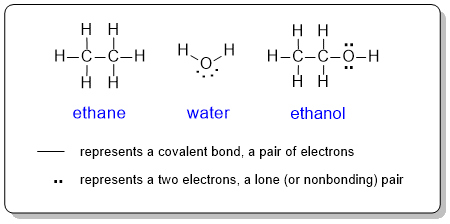
In organic chemistry, drawing a Lewis structure showing each of the atoms could be a (very) time consuming process. Therefore, to be more efficient, organic chemists routinely line diagrams instead.
In a line diagram, C and attached H atoms are typically not shown explicitly. All other atoms are presented by their chemical symbols.
Each node in a line diagram represents a C atom unless indicated otherwise and any H atoms attached to heteroatoms (i.e. atoms other than C) must be shown. Any formal charges must be shown.
As a student learning organic chemistry, it is a good idea to show lone pairs on hetereoatoms, especially N and O.

Wedge-hash diagrams
Wedge-hash (or wedge-dash) diagrams are the most common representation used to show 3D shape as they are ideally suited to showing the structure of sp3 hybridised (tetrahedral atoms). They are rarely needed for sp2 (e.g. alkenes) or sp systems (e.g. alkynes).
Wedge-hash diagrams are usually drawn with two bonds in the plane of the page, one infront of the plane, and one behind the plane. This gives the molecule 3D perspective: we envisage the bold lines being closer to us and the hashes fading away in the background.
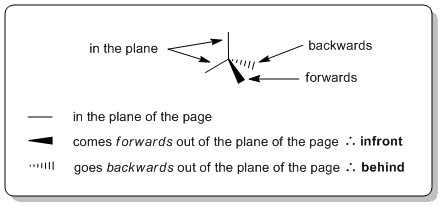
When drawing wedge-hash it is a good idea to visualise the tetrahedral arrangement (or the appropriate geometry) of the groups and try to make the diagram look like this. It is worth looking at the drawing and asking yourself does it make geometric sense ? Can you see the shape you are trying to depict ? If the answer to that question is "no", then the diagram is inadequate and should be redrawn.

As a suggestion, they seem to be most effective when the "similar" pairs of bonds (2-in-plane, 2-out-of-plane) are next to each other, as shown in the left box above.
Here are some other examples to review:

Remember that diagrams are being used to present the required information efficiently. Organic chemists use line diagrams to represent structures as part of the symbolic code because they are quicker and easier to draw as we can just leave out the C atoms and the H attached to those C atoms because we know to just assume that they are there. This idea also carries over into wedge-hash diagrams. A common scenario is shown below where the bond to an H has been omitted and it is assumed that we know that it is there.

Sawhorse
Sawhorse diagrams are similar to wedge-dash diagrams, but without
trying to use "shading" to denote the perspective. The representation of propane shown below has been drawn so that we are looking at the molecule which
is below us and to our left.

 Newman
projections are drawn by looking directly along a particular bond in the system
(here a C-C bond) and arranging the substituents so that they are equally spaced around the atoms
at each end of that bond. The protocol requires that the atoms within the central
bond are shown as a dot and circle as defined below. Think of them as an end on view of a particular bond and the showing the arrangement of the groups around that bond.
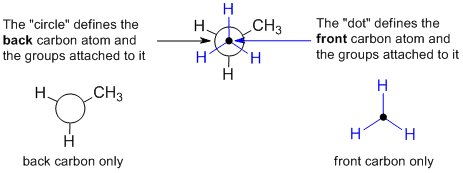
In order to draw a Newman projection from a wedge-dash diagram, it is useful to imagine putting your "eye" in line with the central bond in order to look along it.
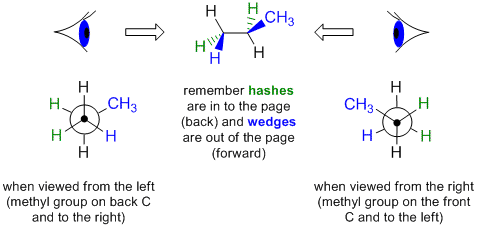
Let's work through an example, consider drawing a Newman projection by looking at the following wedge-dash diagram of propane from the left hand side.
 |
||
| (unselect to undo the rotation) (unselect to undo the rotation) |
Fischer projections are msot commonly used to represent biomolecules such as amino acids and carbohydrates (sugars) as the provide a quick way of representing one or more multiple stereocenters. They tend to be less commonly used by organic chemists because they represent the molecules in an unfavourable conformation, i.e. an "unnatural position".
A Fischer projection is the view of a molecule oriented with the carbon chain oriented vertically and all the horizontal bonds oriented towards the observer (like arms coming out the hug you).
Note that Fischer projections of carbohydrates are typically drawn with the longest chain oriented vertically and with the more highly oxidised C (the carbonyl group) at the top. Here we see the Fischer projections of the simplest carbohydrate, glyceraldehyde in its (S)-(-)- and (R)-(+)- forms:

S-(-)-glyceraldehyde
R-(+)-glyceraldehyde
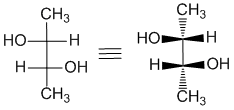
Here is an example of a Fischer diagram with the stereochemistry at 2 centers. It's the same idea, carbon chain vertical and the horizontal bonds towards you. One way to "decode" a Fischer projection, is to draw in wedges and hashes to "reveal" the orientation of the bonds. This can help visualise the shape.
Drawing Cyclohexanes
Drawing cyclohexane so that it looks like a chair can be the key to appreciating
the difference between the axial and equatorial positions. If you are unable to draw good looking structures
that clearly show axial and equatorial positions, then your instructor is probably
going to assume that you don't know.
By not mastering the trick of drawing cyclohexanes the only person that really suffers is you the student. You deprive yourself of the knowledge and the chance to appreciate it, what it means and most importantly what it can tell you. Believe me, it will be needed later.
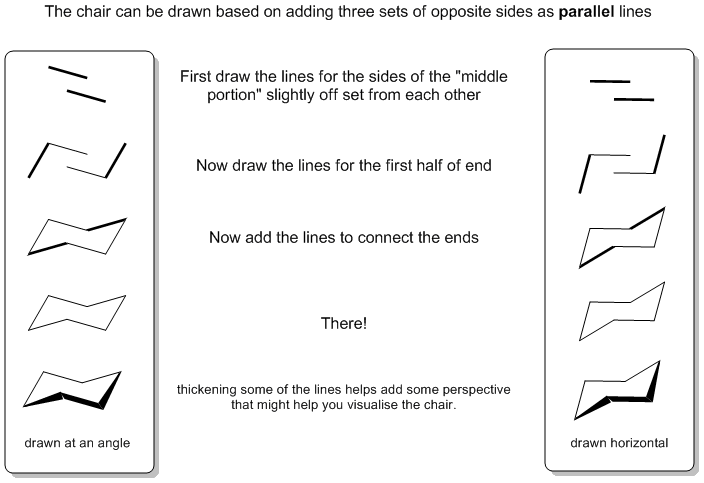
The first step is drawing the chair itself. Although the chair "looks better" when slightly angled, it maybe easier to "learn" to draw it with the middle portion horizontal.
| © Dr. Ian Hunt, Department of Chemistry, University of Calgary |