| Chapter 13: Spectroscopy |
| Chapter 13: Spectroscopy |
Mass spectra
Time to look at a few more spectra.....
A mass spectrum is really just a frequency bar graph. The x axis is the mass to charge ratio (m / z), where z is usually 1. The y axis is the relative intensity (how often is the ion observed compared to the most common ion (the base peak)).
The MS of a typical hydrocarbon, n-decane is shown below.
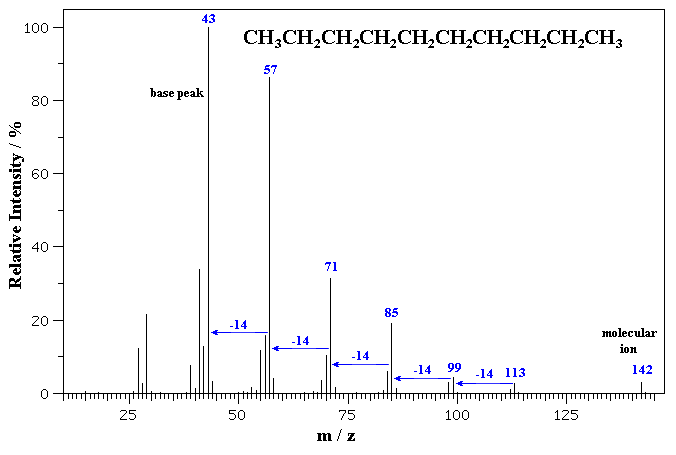
The molecular ion is seen as a small peak at m/z = 142. C10H22 = (10 x 12) + (22 x 1) = 142 g/mol
Notice the series ions detected that correspond to fragments that differ by
14 mass units, formed by the cleavage of a C-C bond between the different -CH2-
units (and not by the ions falling apart by repeated loss of -CH2-
units).
The MS of benzyl alcohol is shown below.
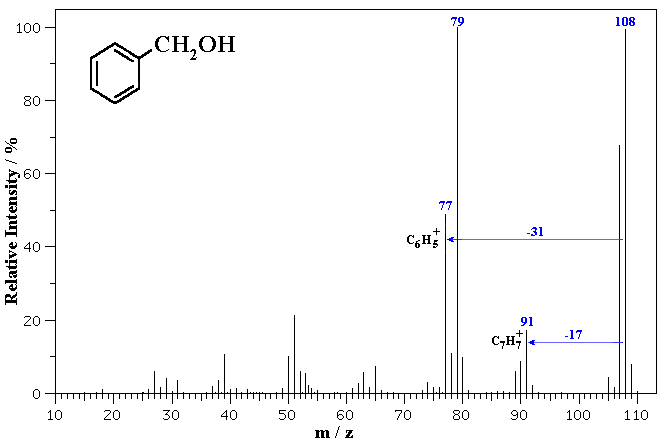
The molecular ion is seen at m/z = 108. Note the small peaks at 109 and 110 which correspond to the presence of small amounts of 13C in the sample (which has about 1.1% natural abundance).
Fragmentation via loss of 17 (loss of OH) gives a common fragment seen for alkyl benzenes at m/z = 91. Loss of 31 (loss of CH2OH) from the molecular ion gives 77 corresponding to the phenyl cation.
|
|
| © Dr. Ian Hunt, Department of Chemistry |